What is Process Mapping: Examples, Symbols, and Types
Most organizations already know their processes need work. The harder problem is getting a clear enough picture of how work actually moves through the business to know where to start. That's what process mapping does. It gives operations teams, transformation leads, and business analysts a shared visual language for understanding workflows—what happens, in what order, who is responsible, and where things break down. Whether you're preparing for automation, investigating a bottleneck, or standardizing how work is done across departments, the process map is usually the first thing on the whiteboard.
This guide covers the mapping process definition, the most useful types, common symbols, and how to build a map that reflects operational reality rather than how the process was designed to work.
What Is Process Mapping, and Why Does It Matter?
Process mapping is a method for visualizing how a process works. It documents the steps, decisions, roles, and handoffs involved in completing a business task, from the moment it starts to the moment it ends.
Mapping Process Definition: What a Process Map Actually Shows
At its core, a process map is a structured diagram that answers three questions: what happens, who does it, and in what sequence. A good process map makes the invisible visible. It shows dependencies that aren't obvious in conversation, surfaces handoffs that get lost between teams, and reveals the gap between documented procedure and actual behavior. Define the mapping process broadly, and it covers everything from a simple flowchart drawn in an afternoon to a data-driven workflow map reconstructed from system event logs. The output can be as simple as boxes and arrows on a page or as detailed as a swimlane diagram showing exactly which team carries responsibility at each stage.
The Purpose of Process Mapping in Enterprise Operations
The purpose of process mapping goes beyond documentation. Organizations use it to:
Identify where delays concentrate and why
Standardize inconsistent approaches across teams or locations
Prepare processes for automation by clarifying inputs, outputs, and decision points
Support training by giving new employees a visual reference for how work should flow
Comply with regulatory requirements that demand documented, auditable processes
Communicate workflow changes clearly across functions
In manufacturing, finance, insurance, and logistics, process maps are often the starting point for any operational improvement program. You cannot fix what you have not first described accurately.
Why Process Mapping Matters for Enterprise Operations
Process mapping earns its place at the start of every serious improvement program because it forces organizations to confront a question most avoid: does the process we think we run match the process that actually runs?
The answer is almost always no. Workarounds develop quietly. Steps get skipped under time pressure. Informal practices fill gaps that nobody documented. Over time, the distance between the process design and the operational reality grows, and with it the gap between expected performance and actual results. Process mapping makes that gap visible. It gives operations teams, transformation leads, and senior decision-makers a shared factual basis for improvement conversations—one grounded in what the process actually does rather than what it was designed to do. Without that foundation, process improvement efforts often address the theoretical process while leaving the real one unchanged.
The benefits that follow are specific and measurable
End-to-end visibility replaces assumptions about how processes work with a documented view of how they actually flow, including the steps that happen in systems nobody thought to include in the original design.
Clearer accountability surfaces during mapping when it becomes obvious which teams own which steps and where handoffs break down because nobody is clearly responsible.
Standardization becomes possible once the actual process is documented, because teams can agree on a consistent approach and train against it rather than each person developing their own variation.
Risk identification happens naturally when a process map shows where single points of failure, approval bottlenecks, or compliance gaps concentrate in the workflow.
Training improves when new employees can see the process as it actually runs rather than reading a procedure document that may no longer reflect reality.
Types of Process Maps and When to Use Each
Different problems need different maps. Choosing the right type is as important as building the map itself.
Flowcharts and Swimlane Diagrams
Flowcharts are the most common process mapping format. They use standard symbols to show steps, decisions, and flow direction in sequence. A flowchart works well when you need to document a straightforward workflow or explain a process to a broad audience quickly. Swimlane diagrams add a layer of accountability. Each horizontal lane represents a team, department, or role, and process steps sit inside the lane responsible for them. Handoffs between lanes are visible at a glance. For workflow mapping across multiple departments—an invoice approval process, a customer onboarding sequence, or a claims handling workflow—swimlane diagrams tend to be more useful than plain flowcharts because they make ownership explicit.
Value Stream Mapping and Manufacturing Process Mapping
Value stream mapping focuses specifically on the flow of materials and information from supplier to customer. It distinguishes between steps that add value and steps that exist for other reasons, which makes it particularly useful in manufacturing process mapping contexts where waste reduction is the goal. A manufacturing process map might trace a product from raw material intake through production stages to dispatch, marking wait times, defect rates, and inventory at each stage. The objective is to find where the process is slower or more expensive than it needs to be and to identify which steps could be removed or compressed without affecting quality.
SIPOC and End-to-End Process Maps
A SIPOC diagram—suppliers, inputs, process, outputs, and customers—provides a high-level view before detailed mapping begins. It is useful at the start of an improvement project when the scope needs to be agreed on before anyone gets into step-by-step detail. An end-to-end process map takes the opposite approach: it traces every step of a complete business process across all functions, from the initial trigger to the final outcome. End-to-end mapping is particularly valuable for identifying the full cost and cycle time of a process, including steps that individual teams don't see because they happen elsewhere in the chain.
Process Mapping Symbols: The Universal Language of Workflow Design
Process mapping symbols give teams a shared visual vocabulary so that maps can be read consistently regardless of who created them.
The most common symbols:
Rectangle: A task or activity—any step where work is performed
Diamond: A decision point—a yes/no or conditional branch in the flow
Oval or rounded rectangle: The start or end of a process
Arrow: The direction of flow from one step to the next
Parallelogram: Data input or output—information entering or leaving the process
Cylinder: A stored data source, such as a database or document repository
These symbols follow standards established by flowcharting conventions used across industries. Teams that mix symbols without agreement end up with maps that mean different things to different people, which defeats the purpose. Consistency matters more than visual sophistication.
How to Create a Process Map That Reflects How Work Actually Runs
The mechanics of process mapping are straightforward. Getting an accurate result is harder.
Define scope first: Clarify where the process begins and ends before mapping anything. The boundary question is often where projects stall—too narrow and the map misses important dependencies, too broad and it becomes unmanageable.
Gather input from the right people: Talk to the people who do the work, not just the people who manage it. Managers often describe the designed process. Frontline staff describe what actually happens. Both perspectives matter, but the frontline view is where operational reality lives.
Map the main path first: Document the standard case—the process as it runs when everything works. Then add decision branches, exceptions, and alternative paths.
Use consistent symbols: Agree on a symbol set before you start and stick to it throughout.
Validate the map: Show the draft to the people who contributed and ask them to check it against reality. A process map that stakeholders don't recognize is not yet accurate enough to act on.
Identify improvement opportunities: Once the map is accurate, look for steps with long wait times, unclear ownership, frequent errors, or redundant actions. These are the places where process optimization efforts are most likely to produce measurable results.
Common Process Mapping Pitfalls
Knowing how to build a process map is one thing. Building one that accurately reflects how the process actually runs is harder, and several predictable problems get in the way.
Relying on management descriptions rather than frontline input is the most common. Managers often describe how processes should work. The people doing the work describe how they actually work. A map built from management interviews alone reflects intentions, not operations.
Mapping the ideal process rather than the current one produces documentation that is useless for improvement purposes. The point of an as-is process mapping exercise is to capture operational reality, including the steps that make the designed process uncomfortable to look at. If the map shows only what everyone agrees the process should be, it is a design document, not a diagnostic tool.
Mapping at the wrong level of detail creates a different problem. Too high and the map misses the steps where time and errors actually concentrate. Too granular and it becomes unreadable and hard to maintain. The right level depends on what decisions the map will be used to support.
Failing to validate with the people involved means errors go uncorrected. A draft map should be reviewed by the teams whose work it describes before it is used for any improvement or automation decision. What looks correct from a design perspective often turns out to be missing informal steps that practitioners consider essential.
Not updating the map after process changes is the final common failure. A process map is only as useful as it is current. Organizations that invest in mapping and then leave those maps unchanged as processes evolve end up making decisions against a picture that no longer exists.
As-Is Process Mapping: Capturing Reality Before You Redesign It
As-is process mapping documents how a process currently operates, not how it was designed or intended to work. It captures the actual path—including the workarounds, informal steps, and deviations that accumulate in any live operation. The as-is process map is the starting point for any serious improvement effort. Without it, redesign projects often fix the theoretical process while leaving the real one untouched. Teams discover this when new procedures fail to take hold because they didn't account for the informal practices employees had developed to cope with gaps in the original design. Building an accurate as-is map usually requires direct observation, interviews with the people who do the work, and—where available—data from the systems those people use. The further the as-is map departs from the documented procedure, the more important it is.
Process Mapping Examples Across Industries
The value of process mapping shows most clearly when applied to a specific operational context.
Financial services organizations map loan origination, account opening, and KYC verification processes to identify where applications stall, where compliance steps are inconsistently applied, and where manual data entry creates both delays and error risk. A map of an invoice approval workflow might reveal that three separate approval steps exist where the original design specified one—each added informally over time to address compliance concerns that were never formally documented.
Manufacturing uses process mapping most commonly in value stream form, tracing a product from raw material intake through production stages to dispatch. A manufacturing process map for a component assembly line might show that 40% of total cycle time is consumed by two handoff steps that add no value—visible only once the full end-to-end flow is documented and the wait times at each stage are measured.
Insurance teams map claims intake and processing workflows to find where claims sit waiting for human action, where documents are re-entered multiple times across different systems, and where the process branches in ways that produce inconsistent customer outcomes. A claims processing map often reveals that the same information is captured three separate times at different stages because the systems involved don't share data.
Logistics organizations map freight documentation workflows—bills of lading, customs declarations, freight invoices—to identify where manual data entry between carrier systems and internal platforms adds time and creates reconciliation problems. A logistics end-to-end process map might show that a document received in one format needs to be manually re-keyed into four different systems before a shipment can be released.
Process Mapping vs Process Mining
Process mapping and process mining both aim to produce a picture of how work flows through an organization, but they approach that goal differently. Process mapping is a manual activity. It relies on interviews, workshops, observation, and documentation to build a structured diagram of how a process is understood to work. The accuracy of the map depends directly on the quality and completeness of the human input. Process mining is data-driven. It reads the event logs that enterprise systems generate automatically—the timestamps and activity records from ERP, CRM, and workflow platforms—and uses those records to reconstruct how processes actually executed across every case in the dataset.
The difference matters in practice. A manually built process map reflects how people understand and describe a process. A process mining output reflects what the data shows actually happened. For complex, high-volume operations where the gap between design and execution is large and the data sources are reliable, process mining produces a more accurate as-is picture faster than manual mapping can. The two approaches work best together. Process mapping provides the shared visual framework that makes process analysis conversations accessible across functions. Process mining provides the data-driven accuracy that makes those conversations factually grounded rather than opinion-based.
How Process Intelligence Extends Process Mapping
Traditional process mapping relies on interviews, workshops, and observation. It is a qualitative activity, which means its accuracy depends on the completeness and honesty of the inputs. Processes that are complex, high-volume, or distributed across multiple systems are genuinely difficult to map this way.
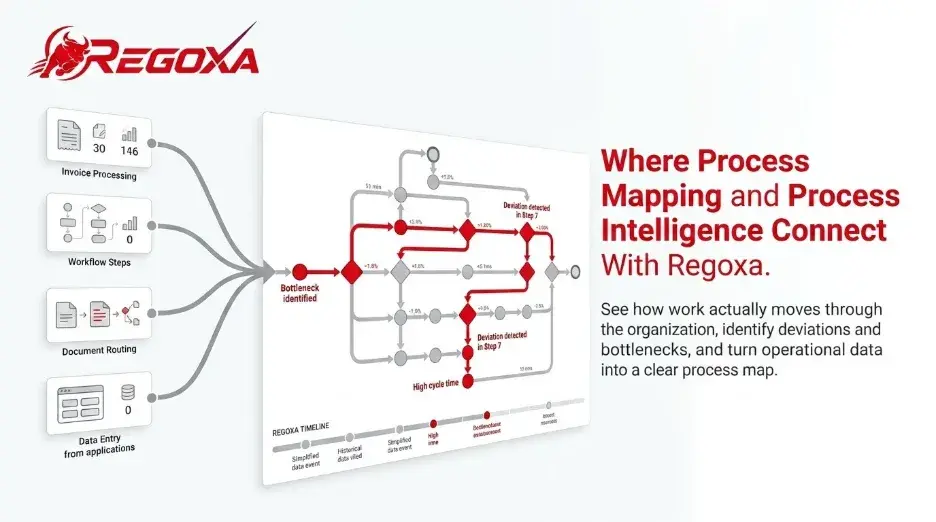
Regoxa Timeline addresses this gap by reconstructing process maps directly from the event log data that enterprise systems already generate. Rather than asking how a process works, Process Discovery within Regoxa Timeline reads the system data and shows how it actually ran—every path, every deviation, and every case that took a different route than expected. The result is an as-is process map grounded in data rather than recollection. It tends to be more accurate, faster to produce, and more revealing than maps built through manual investigation alone. Process analysis then allows teams to go deeper: measuring cycle times at each step, quantifying the frequency of deviations, and identifying the root causes of delays. Process simulation extends this further, allowing teams to test proposed changes against historical process data before committing to implementation—so the question "Will this change actually improve the process?" gets answered by data before any resource is spent. For organizations that also run document-heavy workflows, Regoxa IDP Analytics connects document processing performance to process-level outcomes. A delay caused by a document bottleneck becomes visible within the broader process picture rather than hidden in a separate reporting system. Together, these capabilities turn process mapping from a one-time exercise into a continuous source of operational intelligence.
For enterprise teams ready to go beyond manual mapping, Regoxa Timeline provides process discovery, analysis, and simulation grounded in real operational data.
Key Takeaways
Process mapping visualizes how work flows through an organization, making steps, decisions, roles, and handoffs explicit and shareable
The purpose of process mapping goes beyond documentation—it creates a factual foundation for improvement decisions grounded in operational reality rather than design assumptions
Different map types serve different purposes: flowcharts for clarity, swimlane diagrams for accountability, value stream maps for waste reduction, SIPOC for scope, and end-to-end maps for full cycle visibility
As-is process mapping captures what is actually happening, not what was designed to happen, and is the starting point for any credible improvement program
Common pitfalls include relying on management descriptions, mapping the ideal rather than the current process, and failing to validate with frontline staff
Process mining complements manual process mapping by reconstructing actual process flows from system event data rather than interviews and observation
Regoxa Timeline produces data-driven as-is process maps through process discovery, measures performance through process analysis, and tests improvement scenarios through process simulation
Frequently Asked Questions
What is process mapping?
Process mapping is a method for visualizing how a business process works. It documents the steps, decisions, roles, and handoffs involved in completing a task, giving teams a shared view of how work moves from start to finish.
What is the difference between a process map and a process model?
A process map shows how a process currently works or how it is designed to work, typically as a diagram. A process model is a more abstract representation used for analysis or simulation purposes. In practice, the terms are often used interchangeably, though process models tend to be more formal and data-driven.
What is "as-is" process mapping?
As-is process mapping documents how a process actually operates today, including informal steps, workarounds, and deviations from the official procedure. It is the starting point for any improvement effort because it captures operational reality rather than design intent.
What is manufacturing process mapping used for?
Manufacturing process mapping is used to visualize production workflows, identify waste, reduce cycle times, and improve quality. Value stream mapping is a common technique in manufacturing environments, focusing on the flow of materials and information from supplier to customer.
What are the most common process mapping symbols?
The core symbols are rectangles for tasks, diamonds for decision points, ovals for start and end points, arrows for flow direction, parallelograms for data inputs or outputs, and cylinders for data stores. Using consistent symbols across maps ensures they can be read and understood by anyone in the organization.
How does Regoxa support process mapping?
Regoxa Timeline reconstructs process maps from the event log data that enterprise systems already generate, using process discovery to show how processes actually ran rather than how they were designed to run. Process analysis measures performance at each step, and process simulation allows teams to test proposed changes before implementing them.
What is the difference between process mapping and process mining?
Process mapping is typically a manual activity built from interviews, observation, and documentation. Process mining is a data-driven technique that reconstructs process flows automatically from system event logs. Both produce a picture of how a process works, but process mining is faster, more objective, and better suited to complex, high-volume operations.
What are the benefits of process mapping?
Process mapping delivers end-to-end visibility into how workflows actually run, surfaces accountability gaps where handoffs between teams are unclear, enables standardization by giving everyone a shared view of the correct sequence, improves risk identification by making bottlenecks visible, and provides a practical training tool for new employees. The core benefit is a factual foundation for improvement decisions based on how the process operates rather than how it was designed to run.
What are the different types of process maps?
The most commonly used types are flowcharts, which show steps and decisions in sequence using standard symbols; swimlane diagrams, which divide the process into lanes by team or role to make accountability explicit; value stream maps, which trace the flow of materials and information from supplier to customer; SIPOC diagrams, which provide a high-level view covering suppliers, inputs, process steps, outputs, and customers; and end-to-end process maps, which trace the complete workflow across all functions from initial trigger to final outcome. Each type serves a different purpose depending on what the map is meant to support.
Comments